
“Even the intelligent investor is likely to need considerable willpower
to keep from following the crowd.
~ Benjamin Graham, father of value investing
“I’m just gonna shake, shake shake, shake, shake.
Shake it off. Shake it off.”
~ Taylor Swift, international pop star and philosopher
So far, 2016 has tested investors’ willpower. Ultimately, patience paid off. And markets were able to shake off a lot of potentially bad news!
It’s been a busy year! We started 2016 with the largest drawdown since 2011, and ended the first half of 2016 with one of the biggest geopolitical surprises in recent memory. There were plenty of moments that tempted undisciplined investors to bail out. It’s certainly been a challenging environment for even the most intelligent investors.
Global stocks turned in mixed performances in second quarter of 2016, while U.S. markets led the way. Domestic large cap stocks extended Q1’s marginal gains with the S&P 500 Index of large U.S. stocks up 1.89% for the quarter and now 2.69% for the year.
In Q2, U.S. markets were resilient, doing their best Taylor Swift imitation with a rousing rendition of “Shake It Off.”
Markets shook off the impact of mediocre earnings, as well as geopolitical instability. Investors focused on first quarter earnings during April and May. Year-over-year earnings declined -6.7%, which marked the fourth consecutive quarterly decline, but still exceeded expectations of -8.8%.
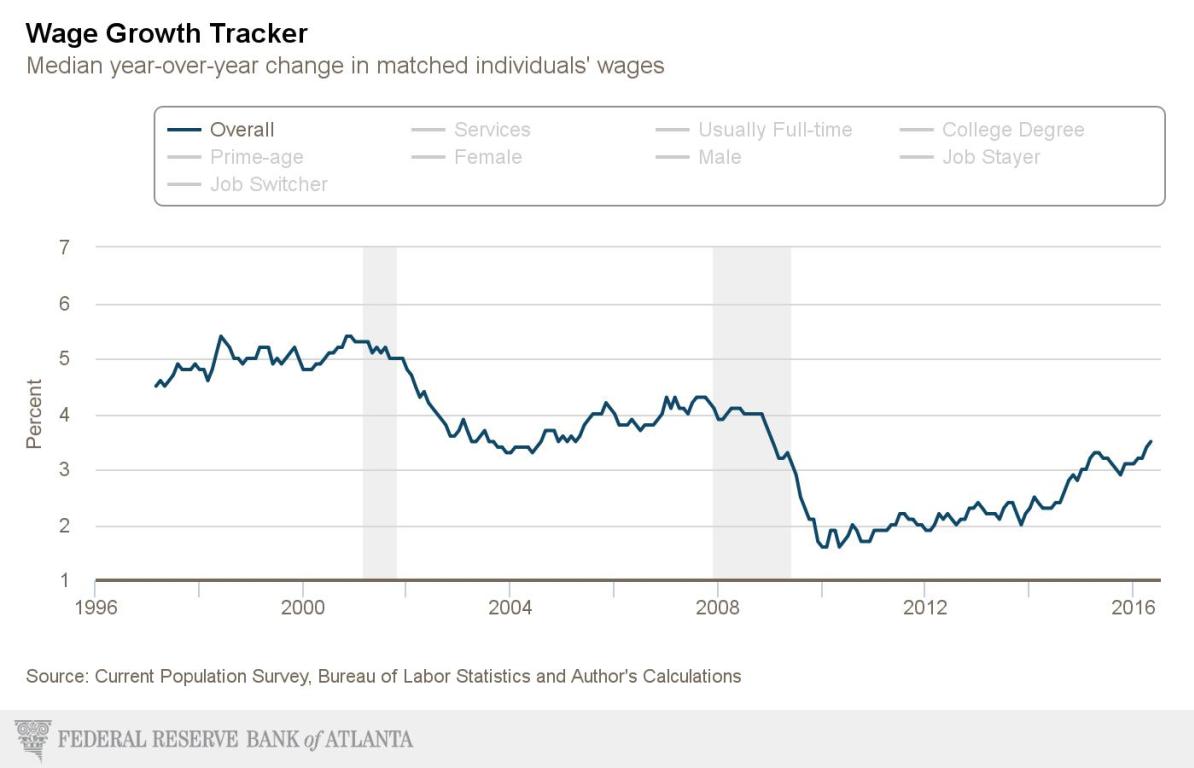
Six out of ten sectors reported year-over-year decline in earnings, led by Energy and Materials. Once earnings season ended, investors turned their focus to wage acceleration, unemployment drop, and better-than-expected housing reports. As shown in the chart below, wage growth increased by 3.4% and 3.5% in April and May, the highest levels since February 2009. This defies the general feeling across America that the economy is trapped in malaise. Remember: The media don’t report on good news!
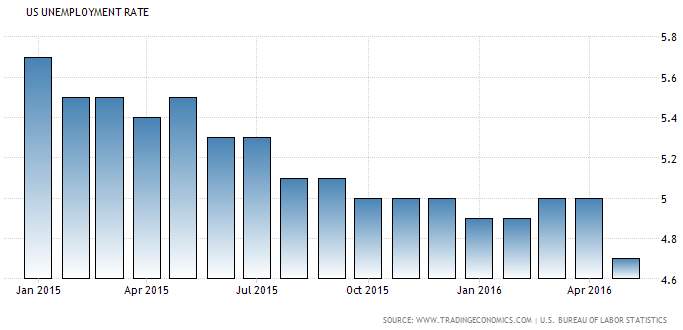
Nonetheless, there are still areas of concern: Unemployment rate dropped to 4.7% as more disheartened Americans stopped looking for jobs. On a positive note, this release also cleared any doubts about the correlation between cheap money and higher stock prices. Even the worst job growth in 56 months did little to dent the market advancement, as calming words from Federal Reserve chair Janet Yellen reinforced the message that a rate increase isn’t in the cards anytime soon.
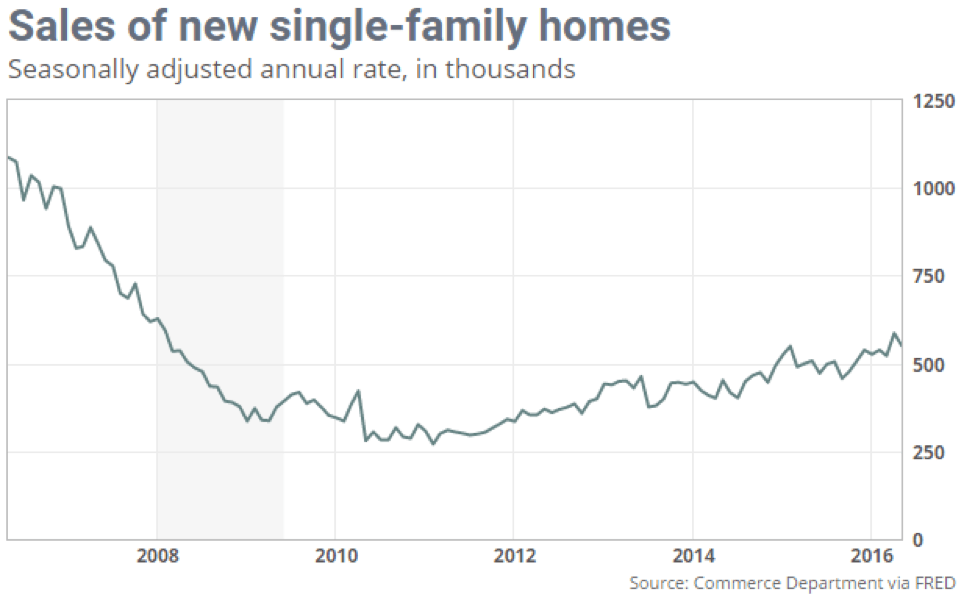
Perhaps one of the biggest shockers of all was the sharp increase in new home sales. Sales soared 23.8% year-over-year to a seasonally adjusted annual rate of 619,000. This marks the biggest monthly jump in 24 years! Seems those Millennials are buying homes, after all!
The impact of new home sales is significant, according to the National Association of Home Builders. Every new 1,000 homes generates 1,970 full-time jobs, $162 million in wages, and $118 million in business income. As builders react to stronger demand for housing, the economic impact is widespread.
How Are Small Stocks Doing?
As our clients know, we always include smaller stocks in our portfolios. In fact, our portfolios, which use funds from Dimensional Fund Advisors, tend to “tilt” toward smaller stocks. That simply means our clients have a notable investment into small stocks, both global and domestic.
The reason for this? Small stocks, over time, tend to outperform their larger peers. Yes, they carry more risk. For that reason, the small stock allocation is tailored for each client’s unique risk tolerance, investment objective and time horizon.
So how did small stocks fare in the second quarter of 2016? Heading into this year, analysts were expecting a tepid market for small-cap stocks, but – as often happens – the analysts got it wrong!
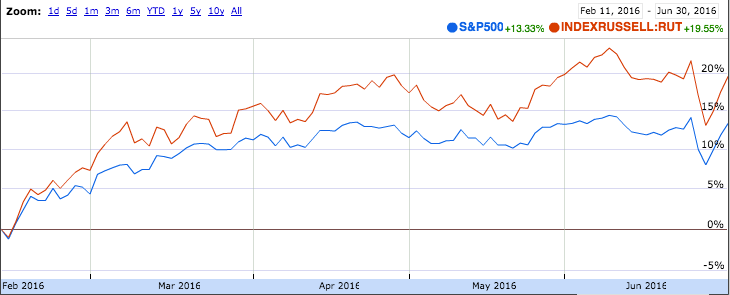
In Q2, as it turned out, buyers snapped up smaller stocks. Since U.S. equity markets bottomed on February 11th, small caps, as measured by the Russell 2000 Index, led their larger counterparts by a wide margin.
In the image below, the red line represents the small-cap Russell 2000, and the blue line represents the S&P 500, which consists of larger domestic stocks. You can easily see the outperformance of smaller equities since February 11th!
Over time, small cap equities’ outperformance is driven by two main factors: Growth potential and size premium. Small-cap growth stocks were one of the worst performers in 2015, but led all other U.S. asset classes in Q2 2016. Similarly, stocks of very small companies, known as microcaps, came back in favor during Q2 and were up more than 4% for the quarter. Strong performance in both small caps and microcap stocks signaled a broadening rally in U.S. equities, as well as an increased willingness for institutional investors to go into “buy” mode.
Again, these facts contradict the endless drumbeat of doom-and-gloom news that you hear in the media!
How Are Companies Doing?
One of the drivers of market performance is company “fundamentals” – a jargony way of saying how much companies are selling, earning and what their margins are.
So far this year, things look pretty good for U.S. stocks. Fundamentals are stronger heading into the second half of 2016 and consumer confidence is much better than expected. U.S. stocks came back in favor after a string of strong data boosting investors’ confidence. With oil prices rebounding to near $50 per barrel and the dollar weakening, two of the main market headwinds have faded.
Not only are fundamentals much stronger, but markets have all but ruled out a July rate rise in the U.S.. The chart below shows that investors mostly do not expect a rate increase until December of 2016.
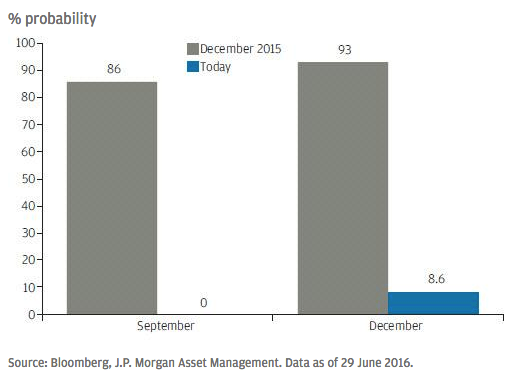
Coming into the year, investors were expecting two to four rate hikes in 2016. Now it appears the “easy money” policy is here for longer.
What About International Stocks?
Our client portfolios all contain international stocks, for the simple reason that they frequently behave differently than domestic stocks. By owning investments that behave differently from one another, you achieve true diversification. This is based on Nobel Prize-winning science, and it’s far different than owning a bunch of “stuff” and calling your portfolio diversified.
Over the years, there’s been plenty of research and market data illustrating the importance of international investing.
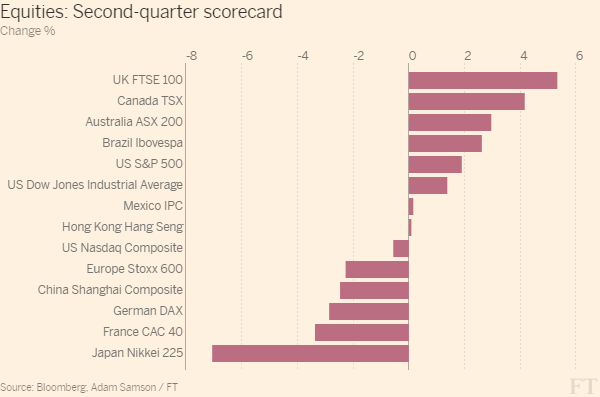
One of the biggest stories for international investors was the U.K. vote to leave the European Union. This event, dubbed “Brexit,” resulted in shockwaves throughout Europe. Contrary to what one would expect, despite the turmoil from the British referendum, the U.K. FTSE 100 index led global markets with 5.5% return in Q2. During this quarter, Japan’s Nikkei 225 slid 7.1%, due to a sharp rise in the Yen, dampening Japan’s exports. Japan was the worst performer among developed markets in the quarter.
International large cap stocks, as measured by the MSCI EFA index, were down -3.31% for the quarter. Brexit was the main culprit, with increased uncertainty leading up to the vote on June 23rd and heightened volatility after the referendum.
How Is the Global Economy Doing?
Economic data coming out of the Eurozone has been stronger than expected throughout Q2. Additionally, the Euro continues to depreciate against the U.S. dollar, which favors European exports. The European Central Bank started buying corporate bonds in June and offering cheap long-term loans to banks to spur credit growth.
In Asia, the Japanese economy is struggling to grow. Although Q1 economic growth in Japan was higher than expected at 1.7%, the underlying inflation is disappointing. Monetary policies have failed to provide the boost the Bank of Japan expected and now investors speculate that the Japanese government will provide tax cuts in September.
Developed international markets are well positioned for a potential rally heading into second half of 2016; Brexit is now in the rear view mirror and the European Central Bank, as well as the Japanese government are both planning for further stimulus. However, always remember: No matter how bleak or rosy the picture may appear for your investments, markets can defy logic! Although the “logical” case may appear to make sense, it does not always pan out as expected.
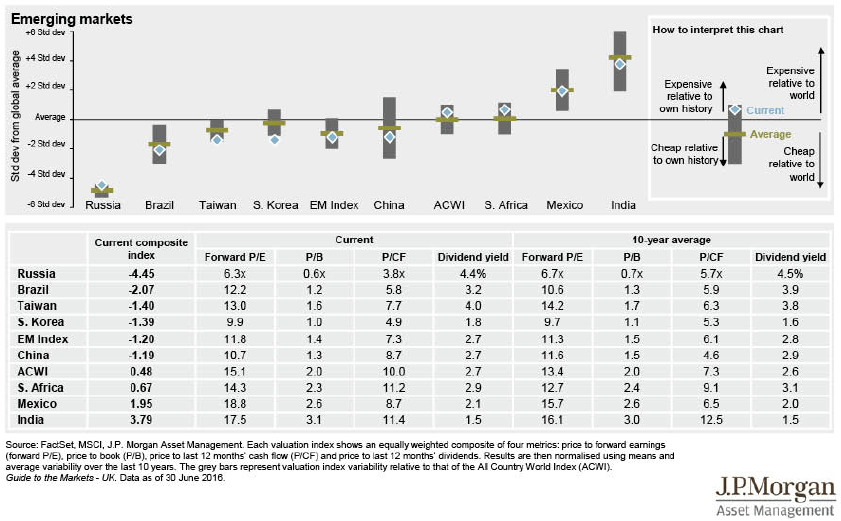
In emerging markets, which settled into flat trading after a promising start to the year, the narrative continues to be dividends and value. Q2 saw the MSCI Emerging Markets Index rise by 0.3%. However, growth slowed in Q2. In particular, Brazilian economy continues to contract even with a rebound in oil prices.
A longer-term catalyst that could attract investors to emerging markets is valuation. As a whole, an emerging-market Index is cheaper relative to the global average. Individually, there are countries trading at cheap valuations and offering patient investors huge growth potential and high dividends.
Heading into Q3, emerging markets still offer investors the most return potential as long as one can stand the price volatility. Here again, our client portfolios are allocated to match personal risk tolerances and time horizons.
Throughout 2016, monetary policy remains accommodative thanks to extremely low overnight rates. The last three months was a mixture of mediocre earnings, disappointing economic data, and Brexit uncertainty. Yet, by the end of the quarter the damage wasn’t as bad as many expected.
There have been multiple stress tests for the markets and the economy but the good news is global markets passed these tests. Bear markets most often occur due to recession or inflation. Recession risk is low with recent economic data showing a firming trend, including consumer spending rising at its fastest rate in seven years. Risk of runaway inflation is remote with the CPI at 0.2% and well under control as it rises gradually under central bank oversight.
As always: Keep these events in perspective. It’s normal for markets to rise and fall. Predictions don’t necessarily come to pass. The scientifically proven way to manage risk and returns is to invest in a broadly diversified portfolio of stocks and bonds, and avoid the cardinal mistakes of market timing, stock picking and performance chasing!